Pitch Deck Metrics vs Power Numbers™: The Data VCs Really Want in 2025
Pitch-deck metrics summarise past performance for investors; Power Numbers™ are forward-looking thresholds that prove a startup can scale systematically.
Why forward-looking validation thresholds beat vanity KPIs for raising capital in AI-era markets
Traditional pitch deck metrics are backward-looking performance indicators that show what happened, while Power Numbers are forward-looking strategic thresholds that prove scalability potential and investment readiness.
Most startup KPIs for investors presentations focus on vanity metrics like total revenue, user growth, and market size without demonstrating systematic scalability or strategic freedom creation. But in AI-era venture capital where business models evolve rapidly and traditional metrics become obsolete quickly, investors need validation-based startup metrics that prove threshold crossing and systematic scaling capability.
Power Numbers replace traditional pitch deck vanity metrics with strategic threshold indicators that demonstrate mathematical validation, resource independence, and sustainable competitive advantage rather than historical performance optimization.
The Pitch Deck Metrics Problem: Why VCs Stop Believing Your Numbers
Most founders present startup KPIs for investors through traditional metrics that worked in slower-moving markets: monthly recurring revenue, user acquisition cost, lifetime value, churn rates, and growth percentages. This backward-looking approach creates three critical fundraising failures:
1. Vanity Metrics vs Strategic Validation
Traditional pitch deck approach:
- Show revenue growth charts trending upward
- Present user acquisition and engagement statistics
- Display market size and opportunity calculations
- Highlight competitive advantages and team credentials
VC reality check: Growth charts don’t prove scalability. VCs have seen thousands of startups with impressive growth that hit walls, pivoted desperately, or burned through funding without achieving sustainable unit economics.
2. Historical Performance vs Future Predictability
Standard pitch deck metrics:
- Monthly Recurring Revenue (MRR) growth rate
- Customer Acquisition Cost (CAC) trends over time
- Lifetime Value (LTV) to CAC ratios
- Monthly churn and retention percentages
Investment insight problem: Historical metrics show what happened under specific conditions but don’t prove the business can scale systematically when conditions change, competition increases, or market dynamics evolve.
3. Single Point Metrics vs System Validation
Traditional investor KPIs:
- Individual metric optimization (reduce CAC, increase LTV)
- Isolated performance improvements
- Competitive benchmarking against industry standards
- Financial projections based on current trajectory
Scaling reality: Business success depends on systematic threshold crossing where multiple metrics achieve specific levels simultaneously, creating mathematical validation that the entire business model works reliably at scale.
How Traditional Pitch Deck Metrics Miss Investment-Ready Validation
Research from Andreessen Horowitz shows that 70% of Series A failures involved startups with strong traditional metrics that couldn’t cross systematic validation thresholds, leading to scaling problems invisible in backward-looking performance data.
Real-World Pitch Deck Metrics vs Power Numbers™ Examples
Traditional Pitch Deck: SaaS Platform (Failed Series A)
Slide 8: Key Metrics
- MRR Growth: 15% month-over-month for 8 months
- CAC: €45 (down from €60 six months ago)
- LTV: €180 (industry average €150)
- Churn: 8% monthly (improving from 12%)
- Users: 2,500 active accounts (growing 20% monthly)
Why VCs passed: Metrics looked good individually but didn’t prove systematic scalability. When growth slowed, CAC increased, and churn spiked during scaling attempts, revealing the business couldn’t maintain performance at higher volumes.
Power Numbers Alternative: Strategic Threshold Validation
Validation Numbers (System Readiness Proof):
- €30 sustainable CAC at 100x current ad spend: Proven through controlled scaling tests
- 5% monthly churn maintained across 3 customer cohorts: Mathematical proof of product-market fit stability
- 40% conversion rate on standardized onboarding process: Systematic validation of customer success methodology
Freedom Numbers (Resource Independence Thresholds):
- €50K MRR enables geographic expansion without survival pressure: Calculated based on operational costs and market entry requirements
- 500 enterprise customers creates negotiating power with partners: Specific threshold that transforms supplier relationships and enables premium positioning
Protection Numbers (Stability Validation):
- 90% feature adoption within first 30 days: Early warning system for customer success and retention
- 72-hour support response time maintained at 10x customer volume: Operational capacity validation for scaling
Why this gets funded: Demonstrates mathematical proof that business model works systematically, with specific thresholds that prove scaling readiness rather than hoping current trends continue.
The Validation Blindness Problem
Zoom Pitch Deck (2011):
- Traditional metrics shown: Video conferencing market size, user growth trends, competitive analysis
- What traditional metrics missed: The systematic validation that video calling could scale to millions of simultaneous users without quality degradation
Power Numbers approach would have emphasized:
- Technical validation: Concurrent user capacity thresholds that prove infrastructure scaling
- Economic validation: Cost per user thresholds that prove profitability at enterprise scale
- Market validation: Customer retention rates that prove sustainable demand rather than novelty adoption
Investment insight: Zoom’s success came from crossing specific technical and economic thresholds that enabled reliable service at massive scale, not from traditional market sizing or user growth metrics.
Power Numbers: Strategic Threshold Validation for Investors
Power Numbers demonstrate investment readiness through mathematical proof that business systems work reliably at scale, enabling confident capital deployment rather than hoping historical trends continue.
The Five Types of Power Numbers™ for Investor Presentations
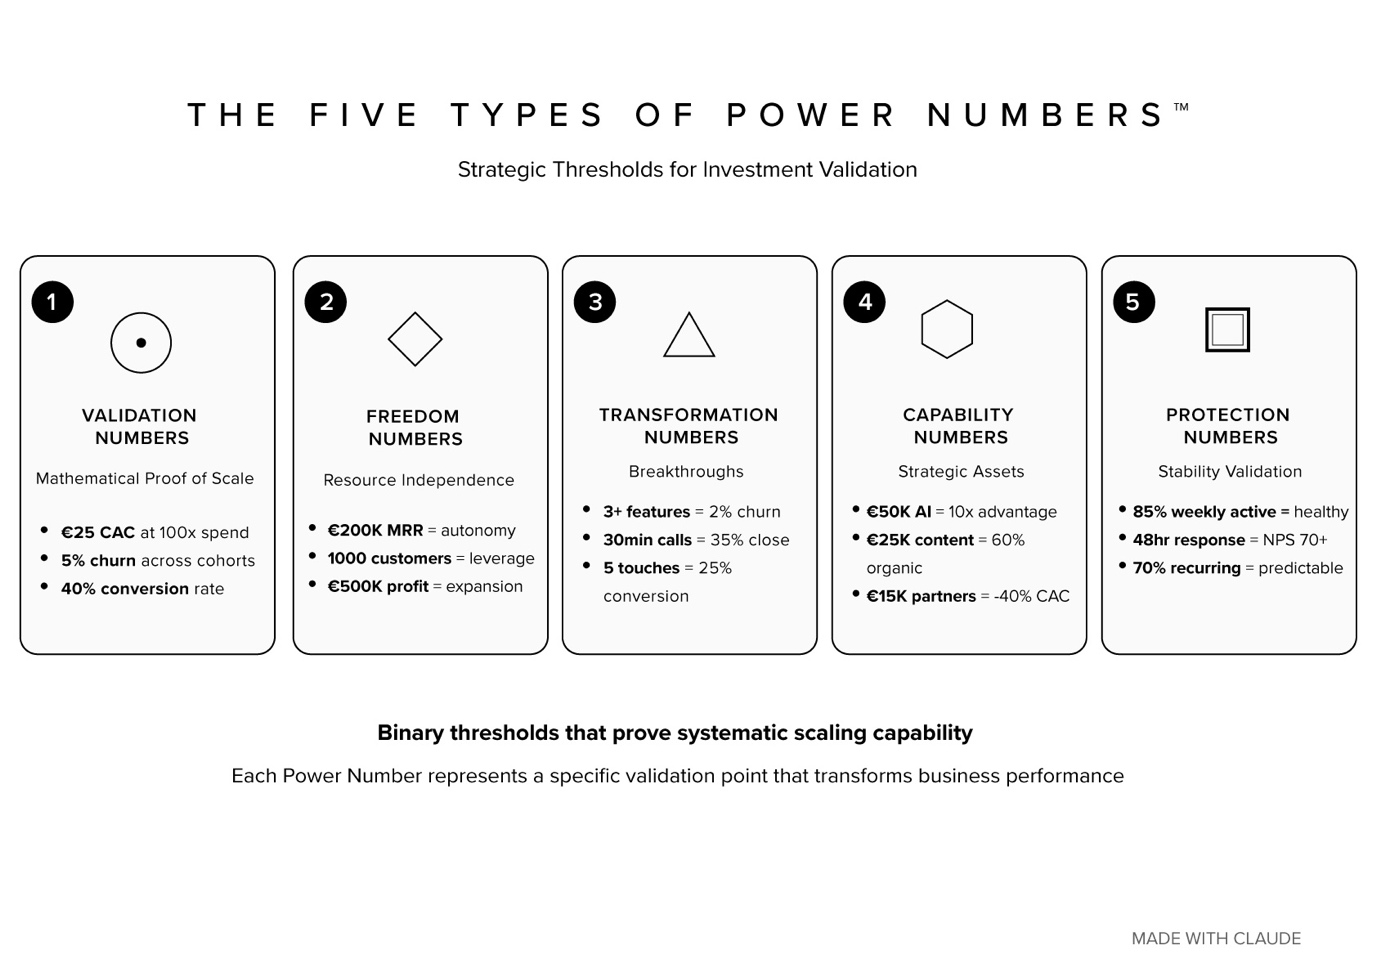
1. Validation Numbers: Mathematical Proof of System Readiness
Purpose: Prove that business model works reliably and can scale systematically Investor insight: Mathematical confidence in scaling rather than extrapolation hope
Examples for Different Business Types:
- B2B SaaS: €25 CAC sustainable at €100K monthly ad spend with 5% churn across multiple customer cohorts
- E-commerce: 15% conversion rate maintained across 10+ product categories with 25% repeat purchase rate
- Marketplace: 65% transaction completion rate with 90% seller satisfaction across 3+ geographic markets
2. Freedom Numbers: Resource Independence Thresholds
Purpose: Demonstrate when business achieves strategic independence and scaling capability Investor insight: Clear understanding of capital efficiency and runway requirements
Examples:
- €200K MRR enables product development independence: No longer dependent on external funding for core innovation
- 1,000 enterprise customers creates vendor negotiating power: Economies of scale that improve unit economics automatically
- €500K monthly gross profit funds geographic expansion: Self-funded growth capability reducing dilution risk
3. Transformation Numbers: Performance Breakthrough Points
Purpose: Show data-driven thresholds where performance dramatically improves Investor insight: Evidence of systematic optimization rather than random improvement
Examples:
- Sales reps with >85 AI coaching score achieve 25% conversion rate vs 12% below threshold: Systematic performance improvement through technology
- Customers using >3 features have 2% monthly churn vs 15% for single-feature users: Product stickiness validation through usage patterns
- Content pieces with >1,000 social shares generate 10x organic traffic: Content marketing scalability proof
4. Capability Numbers: Strategic Asset Building Thresholds
Purpose: Demonstrate investment levels that create sustainable competitive advantages Investor insight: Understanding of capital allocation for competitive moat building
Examples:
- €50K monthly AI development investment creates 10x productivity advantage over manual competitors
- €25K monthly content creation generates SEO authority enabling 60% organic customer acquisition
- €15K monthly partnership development creates exclusive channel access reducing CAC by 40%
5. Protection Numbers: Stability and Risk Management Validation
Purpose: Show early warning systems and stability metrics that protect investment value Investor insight: Risk mitigation and operational reliability evidence
Examples:
- 85% weekly active user engagement maintains healthy retention: Leading indicator preventing churn increases
- 48-hour customer issue resolution time protects NPS above 70: Customer satisfaction early warning system
- 70% recurring revenue concentration provides predictable cash flow: Revenue stability for planning and scaling
Traditional Metrics vs Power Numbers: The Investor Presentation Comparison
| Element | Traditional Pitch Deck Metrics | Power Numbers |
|---|---|---|
| Data Orientation | Backward-looking performance tracking | Forward-looking threshold validation |
| Scaling Evidence | Extrapolation from current trends | Mathematical proof of systematic scalability |
| Investment Rationale | Growth trajectory and market opportunity | Threshold crossing that enables predictable scaling |
| Risk Assessment | Competitive analysis and market risks | Protection numbers that provide early warning systems |
| Success Measurement | Revenue and user growth percentages | Binary threshold achievement creating strategic freedom |
| Capital Efficiency | Cost optimization and unit economics | Resource independence thresholds reducing funding dependence |
| Competitive Advantage | Product features and team capabilities | Capability numbers that create systematic advantages |
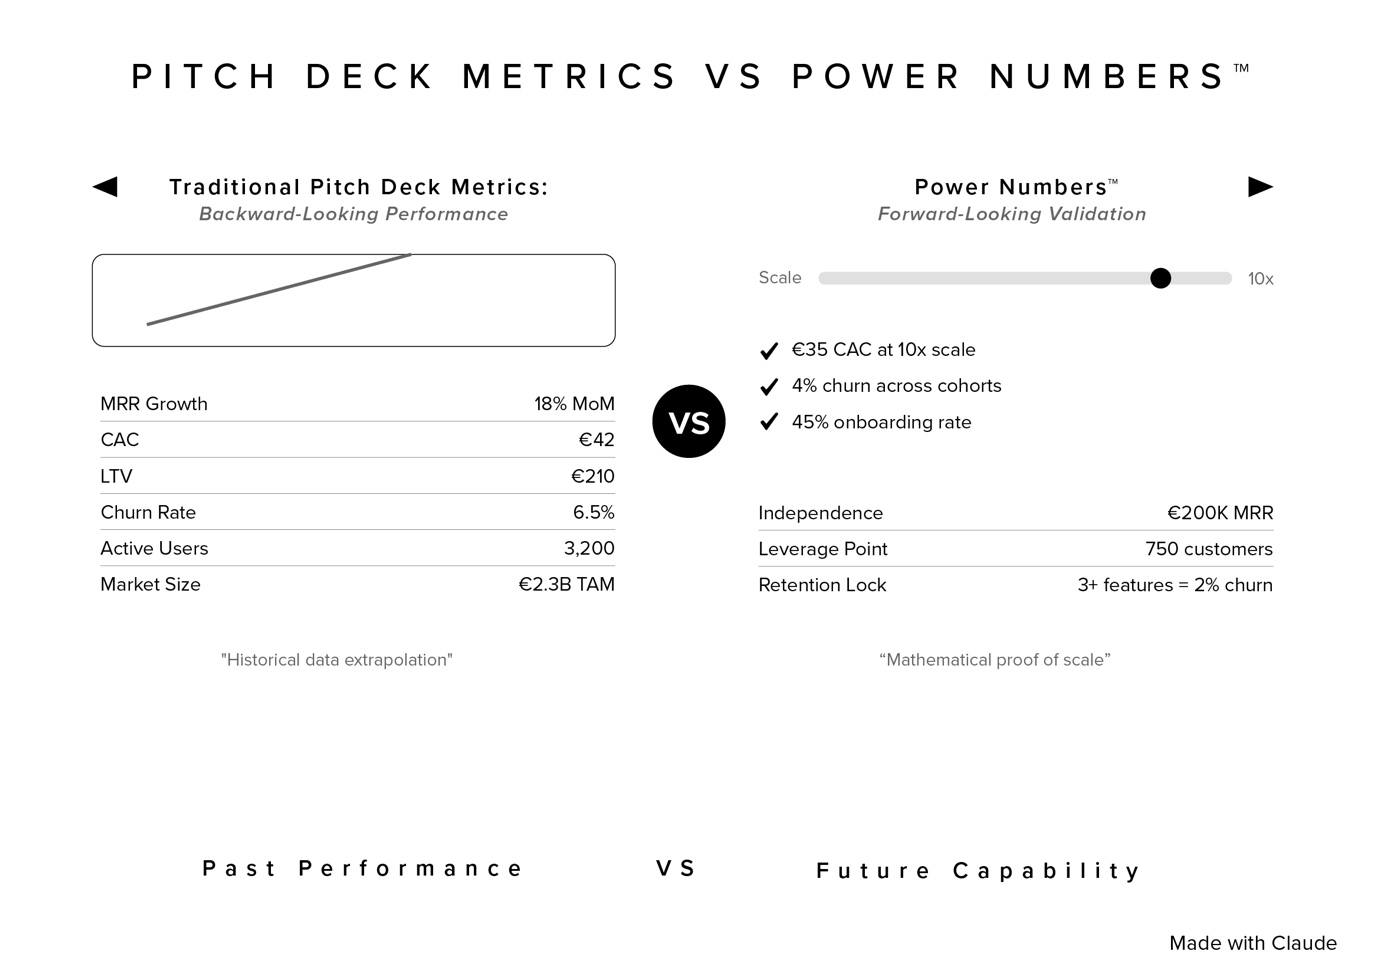
Power Numbers™ Slide Transformation: Before vs After
Before: Traditional Pitch Deck Metrics Slide
Slide 8: Key Performance Metrics
Monthly Recurring Revenue: €125K (+18% MoM) Customer Acquisition Cost: €42 (↓ from €55 last quarter) Lifetime Value: €210 (industry benchmark: €185) Monthly Churn Rate: 6.5% (improving from 9% last year) Active Users: 3,200 (25% growth QoQ) Market Size: €2.3B TAM, €450M SAM
Why this fails with VCs: Shows historical performance but no proof that metrics can be maintained during scaling. Doesn’t demonstrate threshold crossing or systematic validation.
After: Power Numbers™ Strategic Validation Slide
Slide 8: Strategic Validation Thresholds
Validation Numbers – System Readiness Proven ✓ €35 CAC sustainable at 10x current ad spend (tested €50K campaign) ✓ 4% churn maintained across 4 customer cohorts (6-month validation) ✓ 45% onboarding completion rate standardized across sales team
Freedom Numbers – Strategic Independence Points • €200K MRR = Product development independence (calculated breakeven) • 750 customers = Vendor negotiating power (3x economies of scale) • €75K monthly profit = Self-funded expansion capability
Transformation Numbers – Performance Breakthrough Points • Customers using 3+ features: 2% churn vs 12% single-feature • Sales calls >30 minutes: 35% close rate vs 15% shorter calls • Email sequences >5 touches: 25% conversion vs 8% single email
Protection Numbers – Stability Validation • >80% feature adoption within 14 days = retention protection • <24-hour support response = NPS protection above 65 • >60% recurring revenue = cash flow predictability
Why this gets funded: Demonstrates mathematical proof that business model works systematically with specific thresholds that enable confident scaling investment.
The Power Numbers Investor Presentation Framework
Slide 7: Market Validation (Replace Market Size)
Instead of: Total Addressable Market calculations and competitive analysis Power Numbers approach: Validation Numbers that prove market demand at scale
Framework:
- Customer acquisition validation: Specific thresholds proving sustainable demand
- Retention validation: Mathematical proof of product-market fit through cohort analysis
- Pricing validation: Revenue per customer thresholds that prove willingness to pay
Slide 8: Business Model Validation (Replace Financial Projections)
Instead of: Revenue projections and growth assumptions Power Numbers approach: Freedom Numbers that prove resource independence
Framework:
- Operating independence thresholds: Revenue levels that eliminate funding dependence
- Strategic freedom points: Customer or revenue levels that enable competitive advantages
- Scaling readiness validation: Thresholds that prove systematic growth capability
Slide 9: Competitive Advantage (Replace Feature Comparison)
Instead of: Product feature matrices and competitive positioning Power Numbers approach: Capability Numbers that demonstrate systematic advantages
Framework:
- Technology investment thresholds: R&D levels that create unassailable advantages
- Network effect validation: User levels that create winner-take-all dynamics
- Data advantage points: Information collection thresholds that enable superior decision-making
Slide 10: Risk Mitigation (Replace Use of Funds)
Instead of: Generic funding allocation plans Power Numbers approach: Protection Numbers that demonstrate risk management
Framework:
- Operational stability thresholds: Metrics that ensure service quality during scaling
- Customer satisfaction protection: Early warning systems preventing churn increases
- Financial stability validation: Cash flow and margin protection during growth phases
Common Power Numbers Presentation Mistakes
Mistake 1: Using Power Numbers as Traditional KPIs
Wrong approach: Present Power Numbers as monthly tracking metrics Correct approach: Emphasize threshold crossing and binary achievement that enables next scaling phase
Mistake 2: Focusing Only on Validation Numbers
Wrong approach: Show only system readiness proof without strategic implications Correct approach: Balance validation with freedom, capability, and protection numbers for complete investor confidence
Mistake 3: Theoretical Thresholds Without Proof
Wrong approach: Calculate theoretical Power Numbers without testing validation Correct approach: Demonstrate achieved validation through controlled testing and systematic evidence
Mistake 4: Complex Formulas Instead of Clear Thresholds
Wrong approach: Complicated multi-variable calculations for Power Numbers Correct approach: Simple, binary thresholds that anyone can understand and verify
Startup KPIs for Investors: What VCs Really Want in 2025
Beyond Traditional Metrics: Evidence-Based Scaling
2025 VC priorities:
- Systematic validation over growth rate extrapolation
- Threshold crossing evidence over trend line projections
- Resource independence proof over funding requirement calculations
- Risk mitigation systems over competitive advantage claims
The AI-Era Investment Thesis
Traditional investment logic: Find startups with good metrics in large markets 2025 investment logic: Fund startups that have crossed specific validation thresholds proving systematic scaling capability in dynamic markets
Why Power Numbers matter more: AI accelerates market change, making historical performance less predictive of future success. Investors need mathematical proof that business models work systematically rather than hoping current trends continue.
Ready to Transform Your Investor Presentation?
Power Numbers represent evolution beyond traditional pitch deck metrics toward validation-based investor communication that demonstrates systematic scaling readiness rather than historical performance optimization.
Whether you’re raising seed funding or growth capital, Power Numbers provide the framework for proving investment readiness through mathematical validation and threshold crossing evidence that gives investors confidence in systematic scaling capability.
The choice: Continue presenting historical performance metrics hoping VCs extrapolate future success, or demonstrate Power Numbers that prove systematic validation and scaling readiness.
Get Power Numbersframeworks and complete Strategic Architecture™ methodology delivered weekly → Subscribe to our Substack newsletter for validation-based metrics and systematic scaling techniques that get funded.
Join thousands of founders learning to prove investment readiness through threshold validation rather than hoping historical trends continue.
Prepared by the Strategic Architecture™ Editorial Team, bringing clarity to the frameworks shaping the AI era.
Traditional KPIs track historical performance (what happened). Power Numbers prove future capability (what’s possible) through threshold validation. Instead of “we grew 20% last month,” you show “we’ve proven €30 CAC is sustainable at 10x scale through controlled testing.”
Yes, but lead with Power Numbers for strategic validation, then support with traditional metrics for context. Show threshold crossing first (proof of scalability), then historical performance as supporting evidence.
Start with your biggest scaling constraint and calculate the exact threshold that removes it. For validation, test key metrics at higher volumes. For freedom, calculate resource independence points. For protection, identify early warning indicators.
Show partial validation and clear path to achievement. “We’ve tested €35 CAC at 5x scale, projecting €30 CAC at 10x based on systematic optimization.” Demonstrate testing methodology and progress toward thresholds.
Trademark Notice
© 2025 Edward Azorbo. All rights reserved.
Strategic Inevitability™, Strategic Architecture™, Power Numbers™, iPolaris, Strategic Triggers™, Clear Paths™, Mathematical Freedom Recognition™, Trinity Framework™, and all related names, logos, and framework titles are trademarks or registered trademarks of Edward Azorbo in the United States, the European Union, and other jurisdictions.
Unauthorized use, reproduction, or modification of these marks and the proprietary methodologies they represent is strictly prohibited. All other trademarks and trade names are the property of their respective owners.