Balanced Scorecard Vs the Power Numbers Dashboard
Power Numbers Dashboard replaces Balanced Scorecard by tracking 3–5 binary thresholds that unlock capabilities and cascade effects—so teams know exactly when to act and scale, not just how they performed. :contentReference[oaicite:8]{index=8}
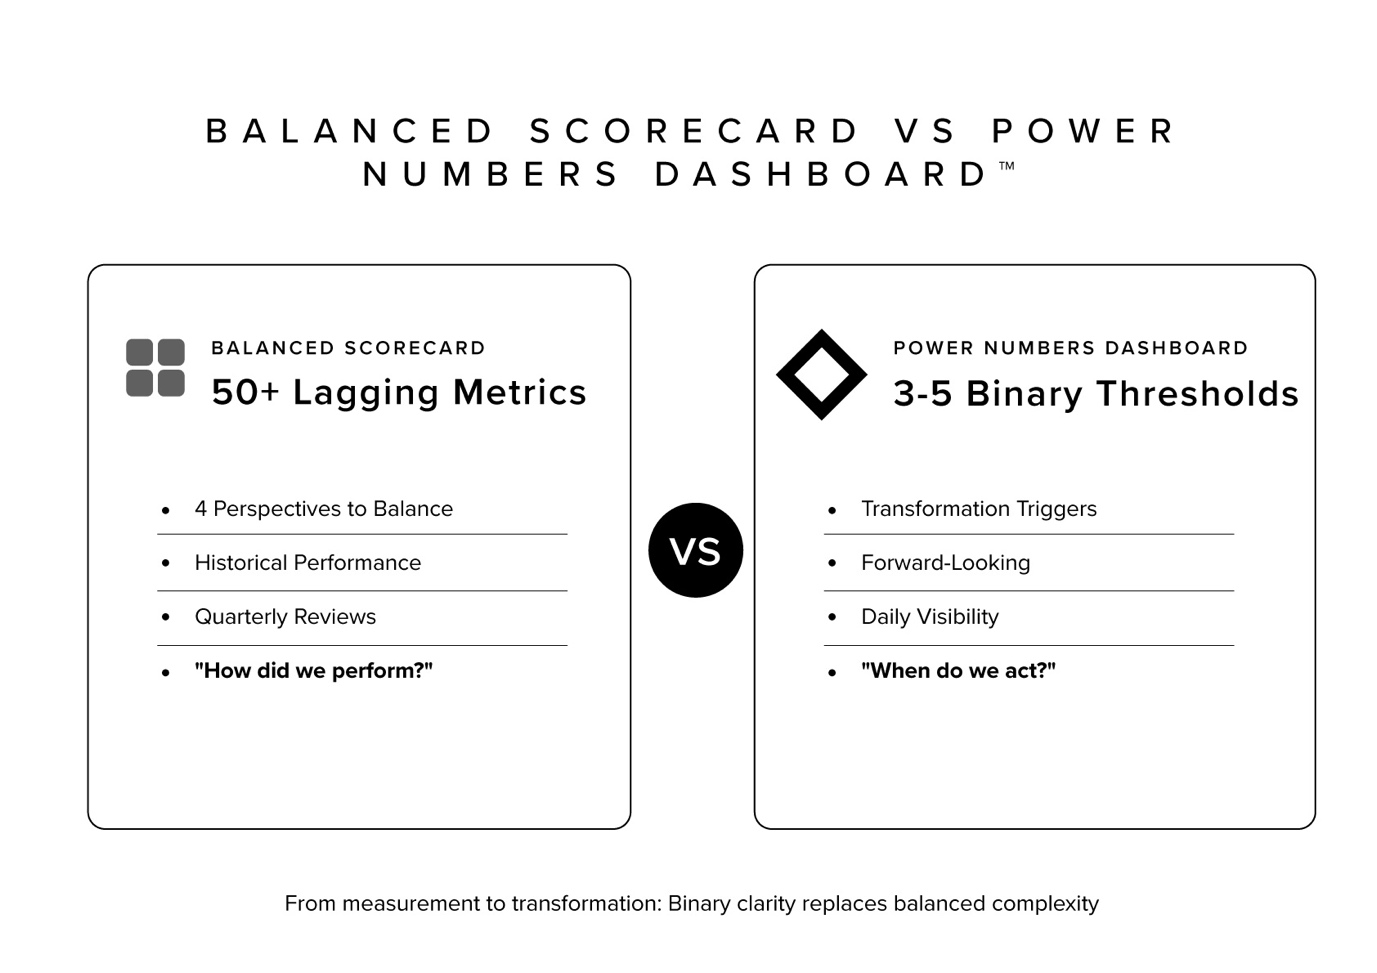
How tracking 3-5 transformation thresholds replaces 50+ lagging indicators when metrics need to trigger action, not document history
The Balanced Scorecard revolutionized performance measurement in 1992 by expanding beyond financial metrics to include customer, internal process, and learning perspectives. But in an era where transformation happens in quarters not years, tracking balanced historical data across four perspectives creates dangerous illusion of control while missing the precise thresholds that actually drive change.
Power Numbers Dashboard replaces 50+ lagging KPIs with 3–5 binary thresholds. Crossing each number triggers an irreversible capability unlock and cascade effects—so teams know exactly when to act, not just what happened.
The Power Numbers Dashboard™ replaces Balanced Scorecard’s retrospective analysis with forward-looking transformation triggers that tell you exactly when to act, not just how you performed. This system presumes Strategic Surplus—the ‘oxygen’ that lets you concentrate force on a few thresholds.
The 1992 Assumption That Breaks in 2025
Robert Kaplan and David Norton’s Balanced Scorecard framework built on three assumptions that no longer serve transformation-focused businesses:
Assumption 1: Balance Equals Strategic Health
What Balanced Scorecard believed: A “balanced” view across financial, customer, internal process, and learning perspectives ensures strategic health.
Transformation reality: Balance often masks critical imbalances that drive breakthrough performance. The startup that obsesses over one critical metric often beats the enterprise tracking 50 balanced KPIs.
I learned this managing my consultancy. We tracked 47 metrics across the four perspectives—all green, all “balanced.” Meanwhile, we missed that hitting €100K MRR was the only number that mattered for unlocking our next phase. Balance distracted us from transformation.
Assumption 2: More Perspectives Mean Better Decisions
What Balanced Scorecard believed: Multiple perspectives prevent myopic focus and ensure comprehensive strategy execution.
Binary reality: More perspectives create analysis paralysis. What matters is identifying the 3-5 numbers that, when crossed, fundamentally change what’s possible in your business.
Example: In 2007, Netflix used a simple proxy: the percentage of members who streamed at least 15 minutes per month (≈5% at launch). One threshold changed everything—driving product and device strategy until streaming adoption crossed critical levels.
Assumption 3: Lagging Indicators Inform Future Strategy
What Balanced Scorecard believed: Understanding past performance across multiple dimensions helps predict and plan future performance.
Threshold reality: Lagging indicators tell you what happened, not what’s about to happen. By the time your balanced scorecard shows problems, the transformation opportunity has passed.
The Power Numbers Dashboard: Binary Transformation Tracking
The Power Numbers Dashboard identifies and tracks the specific thresholds that create fundamental business transformation, replacing balanced perspectives with focused transformation triggers.
The Five Types of Power Numbers™
Freedom Numbers (Resource Liberation)
- Definition: Thresholds that unlock new strategic options previously impossible
- Example: “€50K MRR enables first senior hire, transforming founder capacity”
- Binary nature: Either you can afford the hire or you can’t
- Dashboard signal: Red below threshold, green above—no yellow
Validation Numbers (Proof Points)
- Definition: Thresholds that prove system scalability and methodology
- Example: “15 sales per rep validates our sales process for geographic expansion”
- Mathematical proof: Not opinion, but statistical validation
- Dashboard signal: Binary proof achieved or not achieved
Capability Numbers (Velocity Accelerators)
- Definition: Thresholds that dramatically increase execution speed
- Example: “100 documented SOPs enables delegation without quality loss”
- Transformation: From founder bottleneck to systematic execution
- Dashboard signal: Capability unlocked or locked
Transformation Numbers (Exponential Enablers)
- Definition: Thresholds that enable non-linear growth patterns
- Example: “1,000 active users triggers network effects”
- Cascade impact: Each user now adds exponential value
- Dashboard signal: Transformation threshold crossed or pending
Protection Numbers (Stability Foundations)
- Definition: Thresholds that ensure resilience and sustainability
- Example: “6 months cash runway enables strategic patience”
- Strategic impact: Can now make long-term bets competitors can’t
- Dashboard signal: Protected or exposed
The Binary Revolution: Why Yes/No Beats Percentages
Balanced Scorecard thinking: “Customer satisfaction improved from 72% to 78%” Power Numbers reality: “Have we crossed 50 five-star reviews that trigger marketplace algorithm promotion?”
The difference is action clarity:
- Percentages suggest gradual improvement
- Binary thresholds demand decisive action
- You either crossed the threshold or you didn’t
- No interpretation, no debate, just clarity
Real-World Balanced Scorecard vs Power Numbers Dashboard
Case 1: SaaS Transformation (Internal Case)
Balanced Scorecard Approach:
- Financial: Revenue growth, profit margins, cash flow
- Customer: Satisfaction scores, retention rates, NPS
- Internal: Feature velocity, bug rates, deployment frequency
- Learning: Training hours, skill assessments, innovation metrics
- Result: 52 metrics, weekly review meetings, no clear action triggers
Power Numbers Dashboard Reality:
- Freedom Number: €100K MRR (enables platform team)
- Validation Number: 90% month-2 retention (proves product-market fit)
- Transformation Number: 1,000 active teams (network effects begin)
- Result: 3 numbers, daily visibility, automatic action triggers
Outcome: Went from 52 metrics causing paralysis to 3 numbers driving transformation. Internal case achieved €100K to €1M ARR in 9 months by focusing only on crossing these thresholds.
Case 2: Consulting Firm Evolution (My Experience)
Balanced Scorecard Approach:
- Tracked utilization rates across four perspectives
- Measured project profitability in detail
- Monitored client satisfaction scores
- Analyzed learning and development metrics
- Problem: Great scores, no growth
Power Numbers Dashboard Implementation:
- Validation Number: 5 clients at €30K+ contracts (proves enterprise readiness)
- Capability Number: 3 senior consultants hired (enables founder leverage)
- Protection Number: €200K cash reserves (enables saying no to bad fits)
- Result: Clear thresholds that triggered specific strategic moves
Transformation: Crossed all three thresholds in 6 months. The binary clarity eliminated debate and focused execution.
Case 3: E-commerce Platform (Internal Case)
Balanced Scorecard Metrics:
- 47 KPIs across four perspectives
- Monthly 50-slide review deck
- Quarterly strategy adjustments
- Everyone confused about priorities
Power Numbers Dashboard Replacement:
- Freedom Number: €25K daily revenue (enables inventory investment)
- Transformation Number: 100K email subscribers (organic traffic independence)
- Protection Number: 45-day inventory turnover (cash flow safety)
- Impact: Team aligned, decisions automatic, 3x growth in 12 months (internal case)
The Power Numbers Dashboard Template
Dashboard Design Principles
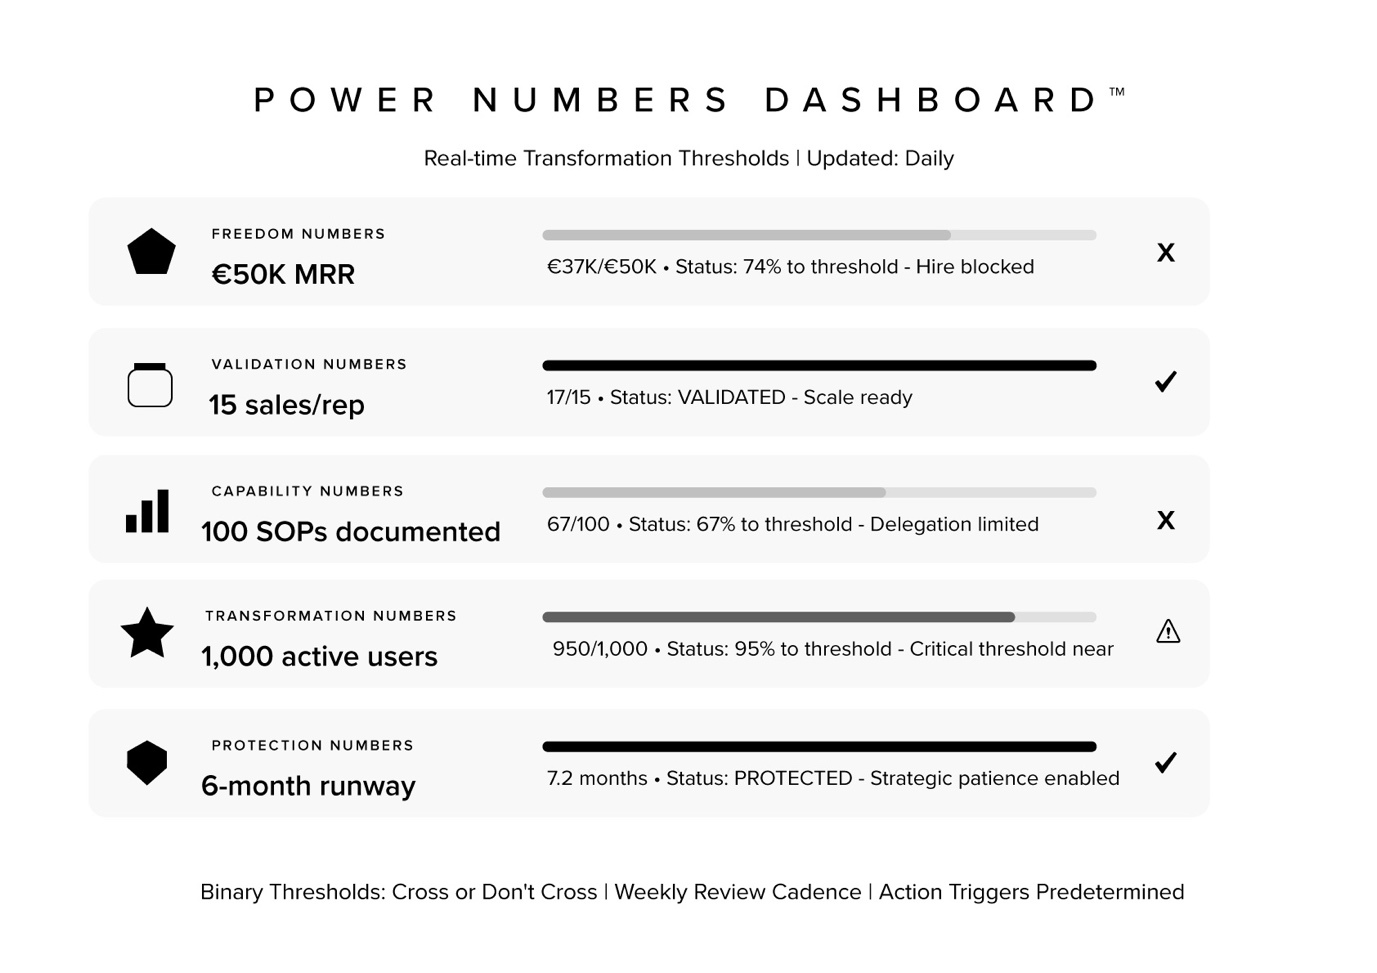
Visual Hierarchy:
[FREEDOM NUMBERS]
€50K MRR ………………. ❌ €37K/€50K
Status: 74% to threshold – Hire blocked
[VALIDATION NUMBERS]
15 sales/rep …………… ✅ 17/15
Status: VALIDATED – Scale ready
[CAPABILITY NUMBERS]
100 SOPs documented ……… ❌ 67/100
Status: 67% to threshold – Delegation limited
[TRANSFORMATION NUMBERS]
1,000 active users ………. ⚠️ 950/1,000
Status: 95% to threshold – Critical threshold near
[PROTECTION NUMBERS]
6-month runway ………….. ✅ 7.2 months
Status: PROTECTED – Strategic patience enabled
Alert System:
- Red: Below threshold – transformation blocked
- Yellow: Within 10% of threshold – sprint required
- Green: Threshold crossed – capability unlocked
- Blue: 2x threshold – next level visible
Implementation Rules
Rule 1: Maximum 5 Numbers Total
- More creates diffusion
- Less misses critical thresholds
- 3-5 is optimal for focus
Rule 2: Binary Measurement Only
- Distance to threshold as percentage is allowed
- Either crossed or not crossed
- No “improving” or “declining”—just yes or no
Rule 3: Threshold Triggers Action
- Each threshold has predetermined action
- No debate when threshold is crossed
- Automatic strategic moves
Rule 4: Weekly Threshold Review
- Daily dashboard visibility
- Weekly threshold distance check
- Monthly threshold recalibration
The Mathematics of Threshold Transformation
Why Linear Metrics Fail
Balanced Scorecard logic: Linear improvement across multiple dimensions
- 10% better + 10% better + 10% better = 30% better
- Reality: Still the same business, slightly optimized
Power Numbers mathematics: Binary transformation at thresholds
- Below €50K MRR: Can’t hire senior talent
- Above €50K MRR: Can hire, unlock 10x founder leverage
- Result: Not 10% better but fundamentally different business
The Cascade Multiplication Effect
When you cross a Power Number threshold:
- Primary unlock: Direct capability gained
- Secondary cascade: What primary enables
- Tertiary effects: System-wide transformations
- Quaternary emergence: New thresholds become visible
Example cascade:
- Cross €100K MRR (primary)
- Hire platform team (secondary)
- Build marketplace features (tertiary)
- Network effects visible at 1,000 users (quaternary)
Common Power Numbers Dashboard Implementation Mistakes
Mistake 1: Including Vanity Metrics
- Wrong: “1M website visitors” (feels good, changes nothing)
- Right: “1,000 email subscribers” (enables direct communication)
- Test: Does crossing this number unlock new capabilities?
Mistake 2: Tracking Too Many Numbers
- Wrong: 15 “Power Numbers” across the business
- Right: 3-5 maximum, ruthlessly prioritized
- Test: Can every team member name all Power Numbers from memory?
Mistake 3: Percentage-Based Thresholds
- Wrong: “Improve retention by 20%”
- Right: “Achieve 90% month-2 retention”
- Test: Is it binary—yes or no—without interpretation?
Mistake 4: Ignoring Protection Numbers
- Wrong: Only tracking growth metrics
- Right: Including at least one Protection Number
- Test: What threshold ensures survival during transformation?
How Power Numbers Dashboard Connects to Strategic Architecture™
Connection to Strategic Triggers™
Strategic Triggers are the execution mechanism for crossing Power Number thresholds:
- Power Number: €100K MRR target identified
- Strategic Trigger: “Achieve €100K MRR by March 31st through enterprise focus”
- Execution: All resources concentrated on crossing this threshold
- Result: Binary success or failure, no ambiguity
Connection to Trinity Framework™
The Trinity Framework determines which Power Numbers matter most:
- Strategic Linchpin: Your core Power Number focus
- Linchpin Enabler: The process that moves the number
- Core Cadence: The rhythm of threshold progress
- Example: MRR (Linchpin) + Sales Process (Enabler) + Weekly Demos (Cadence)
Connection to Mathematical Freedom Recognition
Mathematical Freedom Recognition identifies which numbers are truly “Power Numbers”:
- Test each metric: Does crossing create transformation?
- Validate binary nature: Clear before/after states?
- Confirm cascade: Do secondary effects multiply?
- Verify irreversibility: Once crossed, no going back?
The Evolution from Balance to Binary
The Balanced Scorecard asked: “How did we perform across all dimensions?”
The Power Numbers Dashboard asks: “What thresholds will transform our business?”
This isn’t just a different measurement system—it’s a different philosophy of strategy. Instead of seeking balance across multiple perspectives, you seek breakthrough at specific transformation points.
The mathematical truth: Business transformation isn’t linear and balanced. It’s binary and threshold-driven. You’re either a company that can afford strategic hires or you’re not. You either have product-market fit or you don’t. You either triggered network effects or you haven’t.
Ready to Replace Balance with Breakthrough?
The Power Numbers Dashboard provides systematic framework for identifying and tracking the 3-5 thresholds that actually matter for transformation. Whether you’re scaling a SaaS, building a consultancy, or transforming an enterprise, your strategic focus shouldn’t be balanced across 50 metrics—it should be concentrated on crossing the specific thresholds that unlock new realities.
Stop drowning in balanced scorecards that document history. Start tracking the Power Numbers that create futures.
Get the Power Numbers Dashboard template, threshold identification framework, and complete Strategic Architecture system delivered weekly → Subscribe to my Substack newsletter for transformation metrics and binary breakthrough strategies.
Join thousands of leaders discovering that transformation happens at specific numerical thresholds, not through balanced incremental improvement.
Frequently Asked Questions
Use three tests: (1) Crossing the number unlocks a new capability you don’t currently have; (2) It’s binary—clearly crossed or not; (3) It triggers cascade effects across delivery, trust, or growth.
Track compliance separately as Protection Numbers. Include at least one Protection Number on the dashboard so you safeguard the system while pursuing breakthrough thresholds.
Yes. After a threshold is crossed, it often stops being ‘power.’ Recalibrate quarterly: new thresholds emerge (e.g., after €100K MRR, the next transformation threshold might be €1M MRR).