Customer Acquisition Cost (CAC) vs Value Exchange Velocity: Why Payback Periods Mislead
Customer Acquisition Cost tracks historical spending efficiency; Value Exchange Velocity measures the speed of value flow and payment return, providing forward-looking insight into business health and growth inevitability.
Traditional customer acquisition cost analysis focuses on historical spending efficiency through CAC formulas and CAC payback period calculations without measuring how quickly prospects recognize and exchange value. But effective growth strategy requires understanding Value Exchange Velocity (VEV) – the speed at which value moves to market and payment returns, creating predictive insight into business health.
Value Exchange Velocity replaces static CAC analysis with dynamic value flow measurement: the unified metric that captures both conversion effectiveness AND decision speed, transforming trailing indicators into forward-looking business intelligence.
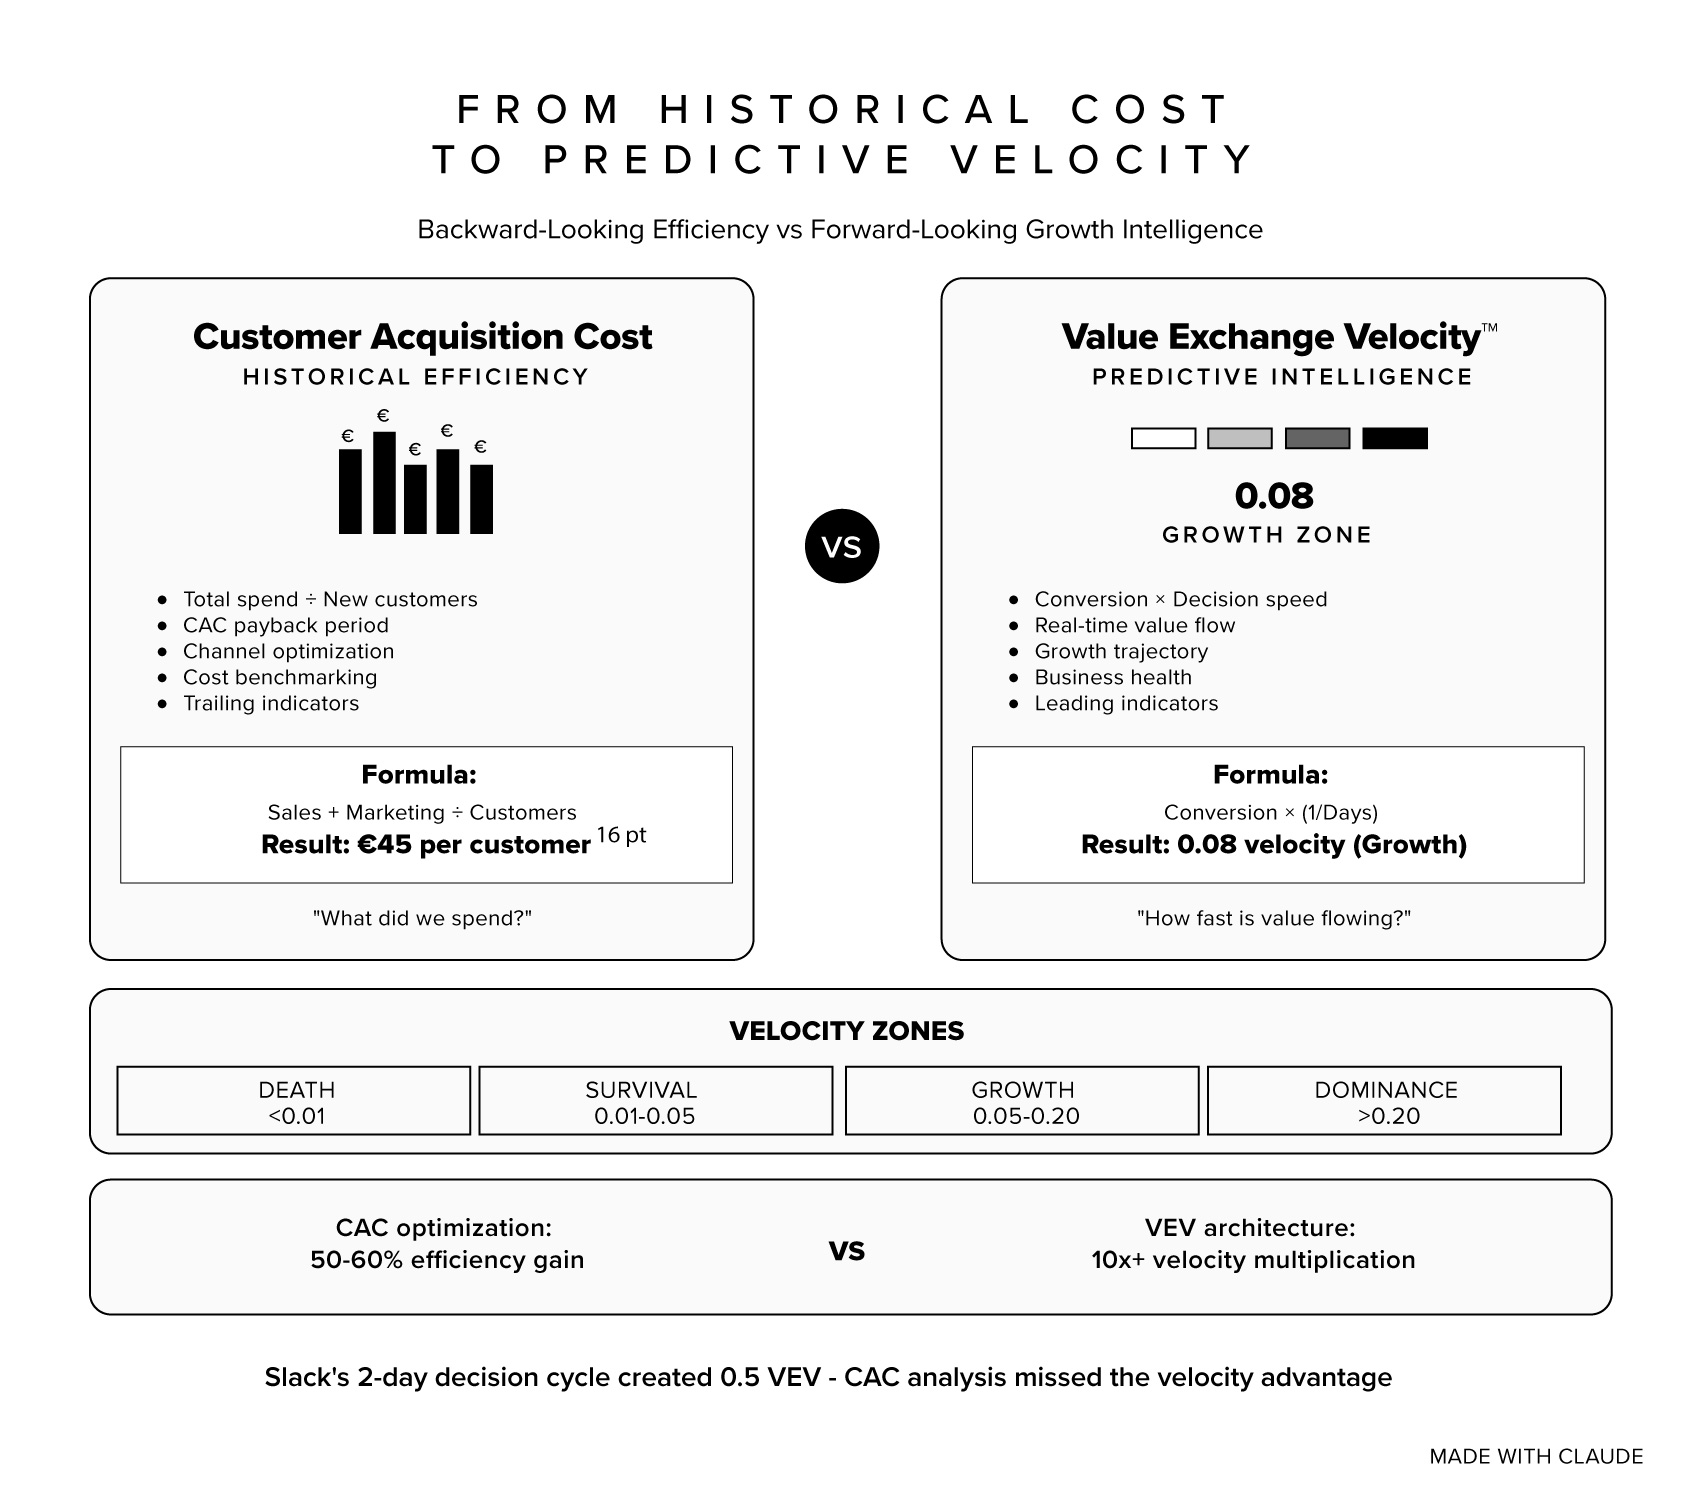
customer acquisition cost formula vs value exchange velocity comparison graphic
The Customer Acquisition Cost Problem: Why Payback Periods Ignore Value Flow Speed
Most organizations analyze growth efficiency through traditional customer acquisition cost metrics: CAC formula calculations, payback period analysis, and cost-per-acquisition benchmarking. This backward-looking approach creates three critical growth strategy failures:
1. Historical Cost Analysis vs Real-Time Value Flow
Traditional CAC approach:
- Calculate total acquisition spending divided by new customers acquired
- Analyze CAC payback period through LTV/CAC ratios and monthly recovery rates
- Benchmark cost efficiency against industry standards and competitive analysis
- Optimize spending allocation based on channel-specific CAC performance
Value flow reality check: CAC analysis shows what you spent to acquire customers but ignores how quickly prospects recognize value and make purchasing decisions. A business with higher CAC but faster value recognition often outperforms lower CAC with slow decision cycles.
2. Static Efficiency Metrics vs Dynamic Velocity Measurement
Standard CAC formula analysis:
- CAC Formula: Total Sales + Marketing Costs ÷ Number of New Customers
- CAC Payback Period: CAC ÷ (Monthly Revenue per Customer – Monthly Costs to Serve)
- Channel attribution modeling for cost optimization
- Cohort analysis for CAC trend identification
Investment insight problem: Traditional customer acquisition cost calculations measure historical efficiency but don’t predict future growth velocity or reveal system health through value exchange speed.
3. Cost-Per-Customer Focus vs Value Recognition Speed
Traditional CAC optimization:
- Reduce acquisition costs through channel optimization and conversion improvement
- Improve targeting to lower cost-per-customer across marketing channels
- Optimize funnels to improve CAC efficiency and reduce acquisition friction
- Scale channels with lowest CAC for resource allocation efficiency
Growth acceleration reality: Success depends on Value Exchange Velocity – how quickly prospects understand value and exchange payment, creating compound growth effects that CAC analysis completely misses.
Real-World CAC vs Value Exchange Velocity Examples
Traditional CAC Analysis: B2B SaaS Platform (Growth Plateau)
CAC Performance Dashboard:
- Paid Search CAC: €45 per customer (industry benchmark: €52)
- Content Marketing CAC: €32 per customer (improving efficiency)
- Overall CAC Payback Period: 8.5 months (target: 6 months)
- CAC/LTV Ratio: 1:4.2 (healthy unit economics)
- Monthly CAC Trend: 12% improvement over 6 months
Strategic Decision: Continue optimizing high-performing channels, reduce spending on higher-CAC sources, focus on improving payback period through retention
Why this misses growth acceleration: Strong CAC metrics but slow value recognition created 45-day average sales cycles, limiting growth velocity despite efficient acquisition costs.
Value Exchange Velocity Alternative: Speed-Focused Growth Intelligence
Value Exchange Velocity Measurement:
Current VEV Analysis:
- Conversion Rate: 18% (industry average: 15%)
- Decision Speed: 45-day average cycle
- Value Exchange Velocity: 0.004 (18% ÷ 45 days)
- Velocity Zone: Death Zone (<0.01 velocity)
Velocity Acceleration Strategy:
Value Clarity Revolution: Reframed value proposition from feature benefits to transformation outcomes
- Impact: Decision speed reduced to 12 days average
- VEV Improvement: 0.015 velocity (18% ÷ 12 days)
- Zone Advancement: Moved to Survival Zone
Trust Architecture Implementation: Deployed systematic credibility building and risk reversal
- Impact: Conversion rate increased to 28%
- VEV Improvement: 0.023 velocity (28% ÷ 12 days)
- Zone Advancement: Entered Growth Zone
Process Friction Removal: Eliminated unnecessary steps in purchasing workflow
- Impact: Decision speed reduced to 7 days average
- VEV Improvement: 0.04 velocity (28% ÷ 7 days)
- Zone Status: Strong Growth Zone performance
Why this creates exponential growth: Value Exchange Velocity improvement from 0.004 to 0.04 (10x increase) generated 340% revenue growth while maintaining similar acquisition costs, proving velocity drives results beyond CAC optimization.
The CAC Blindness Problem
Slack’s Early Growth Analysis (2014):
- Traditional CAC metrics: $60 customer acquisition cost, 3-month payback period, strong unit economics
- What CAC analysis missed: 2-day average decision cycle creating unprecedented Value Exchange Velocity that enabled exponential viral growth
Value Exchange Velocity approach would have emphasized:
- Speed measurement: Decision velocity as primary growth driver
- Value recognition optimization: Systematic reduction of time-to-value realization
- Exchange architecture: Building systems that accelerate value flow rather than just reducing costs
Investment insight: Slack’s dominance came from velocity architecture that made value exchange nearly instantaneous, not from traditional CAC optimization or acquisition cost efficiency.
Value Exchange Velocity: Predictive Growth Intelligence Beyond CAC
Value Exchange Velocity demonstrates business health through value flow speed measurement that predicts growth trajectory rather than analyzing historical acquisition efficiency.
The Value Exchange Velocity Formula and Velocity Zones
Core VEV Calculation
Value Exchange Velocity = Conversion Rate × Decision Speed
Where Decision Speed = 1 ÷ Days to Decision
Advanced VEV Formula: Comprehensive Velocity = (Conversion × Speed × Repeat Rate × Value Size)
The Four Velocity Zones for Business Health
| Velocity Zone | VEV Range | Characteristics | Business Health | Strategic Priority |
|---|---|---|---|---|
| Death Zone | <0.01 | <10% conversion, >60 day cycles | Business dying | Emergency velocity intervention |
| Survival Zone | 0.01-0.05 | 10-25% conversion, 30-60 day cycles | Treading water | Systematic friction removal |
| Growth Zone | 0.05-0.20 | 25-50% conversion, 7-30 day cycles | Healthy expansion | Velocity acceleration and scaling |
| Dominance Zone | >0.20 | 50%+ conversion, <7 day cycles | Market leadership | Velocity protection and evolution |
VEV Threshold Analysis
Growth Velocity Thresholds:
- VEV 0.01: Minimum viable velocity for business survival
- VEV 0.05: Velocity threshold enabling confident scaling investment
- VEV 0.10: Velocity level creating compound growth effects
- VEV 0.20: Velocity dominance enabling market leadership position
The Four Velocity Blocks vs CAC Optimization
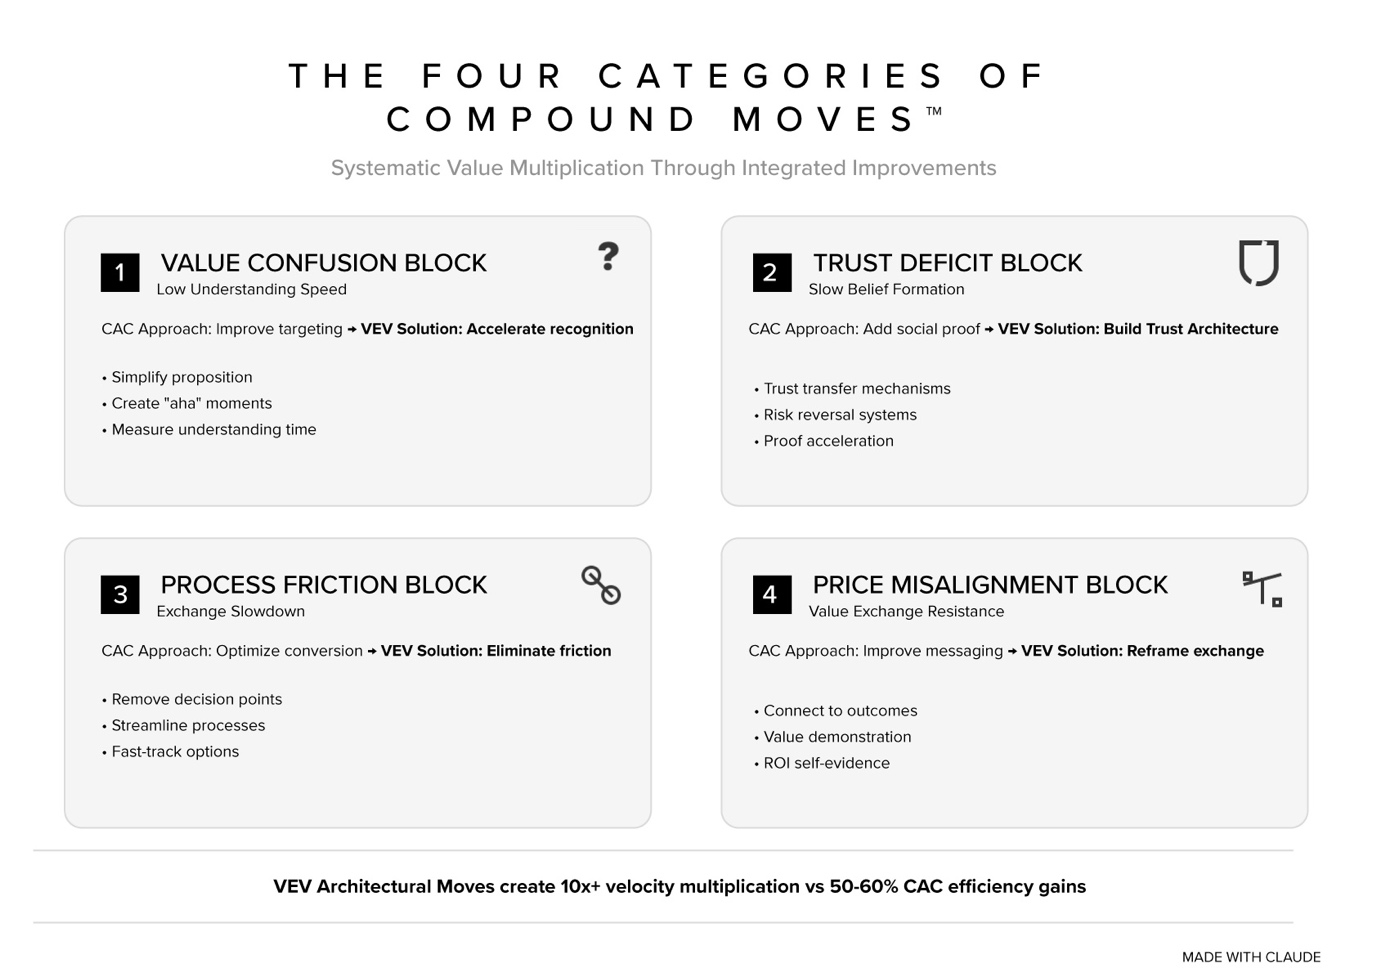
Traditional CAC optimization focuses on cost reduction, while Value Exchange Velocity addresses systematic value flow acceleration:
1. Value Confusion Block (Low Understanding Speed)
CAC Approach: Improve targeting to reach more qualified prospects VEV Approach: Accelerate value recognition through clarity architecture
VEV Solutions:
- Simplify value proposition for instant comprehension
- Create «aha moment» acceleration systems
- Measure time-to-understanding optimization
2. Trust Deficit Block (Slow Belief Formation)
CAC Approach: Add social proof to reduce acquisition costs VEV Approach: Build Trust Architecture for instant credibility
VEV Solutions:
- Deploy systematic trust transfer mechanisms
- Create risk reversal systems
- Implement proof point acceleration
3. Process Friction Block (Exchange Slowdown)
CAC Approach: Optimize conversion rates to improve CAC efficiency VEV Approach: Eliminate decision and purchasing friction systematically
VEV Solutions:
- Remove unnecessary decision points
- Streamline value exchange processes
- Create fast-track purchasing options
4. Price Misalignment Block (Value Exchange Resistance)
CAC Approach: Improve messaging to justify acquisition costs VEV Approach: Reframe value exchange for fairness perception
VEV Solutions:
- Connect pricing to transformation outcomes
- Create value demonstration systems
- Build ROI self-evidence architecture
CAC vs Value Exchange Velocity: The Growth Intelligence Comparison
| Element | Customer Acquisition Cost (CAC) | Value Exchange Velocity |
|---|---|---|
| Focus | Historical spending efficiency analysis | Real-time value flow and exchange speed |
| Measurement | Cost per customer and payback period calculation | Conversion rate multiplied by decision speed |
| Predictive Power | Shows past efficiency, limited future insight | Predicts growth trajectory and business health |
| Optimization Target | Reduce acquisition costs and improve efficiency | Accelerate value recognition and exchange speed |
| Business Health Indicator | Unit economics and cost sustainability | Market understanding and exchange momentum |
| Growth Strategy | Channel optimization and cost management | Velocity architecture and systematic acceleration |
| Strategic Intelligence | Resource allocation and efficiency benchmarking | Value flow optimization and growth inevitability |
Freemium SaaS Case Study: CAC vs VEV Analysis
Traditional CAC Analysis: Freemium SaaS Metrics
CAC Formula Performance:
- Freemium CAC: €0 (organic acquisition through free tier)
- Paid Conversion CAC: €85 per paying customer (includes free user acquisition costs)
- Blended CAC: €12 per user (total costs ÷ all signups)
- CAC Payback Period: 14 months for paid conversions
CAC-Based Decision: Focus on improving free-to-paid conversion rates to reduce effective acquisition costs
Value Exchange Velocity Analysis: Speed-Focused Intelligence
VEV Measurement Across Funnel:
Free Signup Velocity:
- Conversion Rate: 45% (landing page to signup)
- Decision Speed: 1 day average
- Signup VEV: 0.45 (exceptional velocity)
Free-to-Paid Velocity (Critical Bottleneck):
- Conversion Rate: 3% (free to paid)
- Decision Speed: 90 days average (trial + evaluation)
- Paid Conversion VEV: 0.0003 (Death Zone)
VEV Optimization Strategy:
Phase 1: Value Recognition Acceleration
- Reduced time-to-first-value from 14 days to 2 days
- Impact: Decision speed improved to 45 days average
- VEV Improvement: 0.0007 velocity (still Death Zone but improving)
Phase 2: Trust Architecture for Paid Conversion
- Implemented usage-based upgrade prompts and success demonstrations
- Impact: Conversion rate increased to 8%, decision speed to 30 days
- VEV Improvement: 0.0027 velocity (approaching Survival Zone)
Phase 3: Exchange Friction Removal
- Created seamless upgrade flow with value protection guarantees
- Impact: Conversion rate reached 12%, decision speed to 15 days
- VEV Achievement: 0.008 velocity (solid Survival Zone)
Results Comparison:
- CAC Approach: 15% improvement in conversion efficiency
- VEV Approach: 2,567% velocity improvement (0.0003 to 0.008)
- Revenue Impact: 380% increase in monthly recurring revenue growth
CAC vs Value Exchange Velocity™: Implementation Framework
Traditional CAC Optimization Process
- Calculate channel-specific CAC using standard formulas
- Analyze CAC payback period trends and benchmarking
- Optimize highest-performing channels for cost efficiency
- Scale low-CAC channels and reduce high-CAC spending
Value Exchange Velocity™ Implementation Framework
Phase 1: Velocity Baseline Measurement (Week 1)
Current State Analysis:
- Calculate conversion rate across value exchange stages
- Track average decision timeline from engagement to purchase
- Compute baseline Value Exchange Velocity using VEV formula
- Identify velocity zone and biggest acceleration opportunities
Velocity Target Setting:
- Conservative: 50% VEV improvement in 90 days
- Aggressive: 2x VEV improvement in 90 days
- Transformative: 5x VEV improvement in 90 days
Phase 2: Value Clarity Revolution (Weeks 2-4)
Understanding Acceleration:
- Reframe value proposition for instant comprehension
- Create transformation-focused messaging over feature lists
- Test value clarity through prospect explanation accuracy
- Implement «aha moment» acceleration systems
Measurement Focus: Time-to-value-understanding optimization
Phase 3: Trust Architecture Implementation (Weeks 5-8)
Belief Formation Speed:
- Deploy systematic credibility building at every touchpoint
- Create risk reversal offers and guarantee systems
- Implement proof point acceleration and social validation
- Build trust transfer mechanisms from existing assets
Measurement Focus: Proof points required before purchase decision
Phase 4: Exchange Friction Elimination (Weeks 9-12)
Process Acceleration:
- Remove unnecessary decision points and form fields
- Create fast-track purchasing options for ready buyers
- Implement urgency systems with legitimate business reasons
- Optimize payment and onboarding flow for speed
Measurement Focus: Completion rates and decision speed optimization
VEV Architectural Moves vs CAC Optimization
CAC Optimization (Linear Impact):
- Channel optimization: 10-15% efficiency improvement
- Targeting refinement: 15-20% cost reduction
- Conversion improvement: 20-30% CAC enhancement
- Combined effect: 50-60% efficiency gains
VEV Architectural Moves (Exponential Impact):
- Value clarity revolution: 200-500% velocity improvement
- Trust architecture implementation: 300-800% velocity acceleration
- Exchange friction removal: 200-400% speed enhancement
- Combined architectural effect: 10x+ velocity multiplication
CAC vs Value Exchange Velocity: What Growth Strategy Really Needs in 2025
Beyond Cost Efficiency: Velocity Intelligence
2025 growth strategy priorities:
- Value exchange speed measurement over historical cost analysis
- Predictive velocity intelligence over trailing CAC efficiency metrics
- Systematic acceleration architecture over channel cost optimization
- Forward-looking business health over backward-looking spending analysis
The AI-Era Growth Investment Thesis
Traditional growth logic: Optimize acquisition costs and improve channel efficiency for sustainable growth 2025 growth logic: Build Value Exchange Velocity architecture that accelerates value recognition and exchange speed for inevitable growth
Why Value Exchange Velocity matters more: AI accelerates market change and customer expectations, making historical CAC analysis less predictive. Success requires systematic velocity building that creates compound growth effects rather than hoping cost efficiency will drive results.
Engineering Your Growth Velocity Architecture
Value Exchange Velocity represents evolution beyond traditional customer acquisition cost optimization toward velocity-focused growth intelligence that predicts business health and enables exponential growth through systematic value exchange acceleration.
Whether you’re optimizing freemium conversion, B2B sales cycles, or e-commerce checkout flow, Value Exchange Velocity provides the framework for measuring and accelerating the speed of value recognition and exchange that drives sustainable growth.
The choice: Continue optimizing customer acquisition cost hoping efficiency improvements will drive growth, or build Value Exchange Velocity architecture that systematically accelerates value flow and exchange speed.
Get Value Exchange Velocity implementation guides and complete Strategic Architecture methodology delivered weekly → Subscribe to our Substack newsletter for velocity acceleration and systematic growth techniques that create inevitable business expansion.
Join thousands of growth leaders learning to build velocity architecture that predicts and accelerates growth rather than hoping cost optimization will drive results.
Prepared by the Strategic Architecture™ Editorial Team, bringing clarity to the frameworks shaping the AI era.
CAC measures historical acquisition cost efficiency (what you spent per customer). Value Exchange Velocity measures real-time value flow speed (how quickly prospects recognize value and make decisions). Instead of «we acquired customers for €45 each,» you show «our 0.08 velocity indicates strong growth momentum and business health.»
Yes, but prioritize Value Exchange Velocity for growth intelligence, then support with CAC for cost management. Focus on velocity acceleration first (proof of systematic growth), then use CAC analysis for resource allocation and efficiency benchmarking.
Use the VEV formula: Conversion Rate × (1 ÷ Days to Decision). Track prospects from engagement to purchase, measure conversion percentage and average decision timeline. A 25% conversion rate with 10-day average cycle = 0.025 VEV (Survival Zone).
Focus on immediate velocity intervention through the four velocity blocks: value clarity (reduce confusion), trust building (increase belief), friction removal (speed decisions), and price alignment (fair exchange perception). Prioritize the biggest bottleneck first for maximum velocity improvement.
Trademark Notice
© 2025 Edward Azorbo. All rights reserved.
Strategic Inevitability™, Strategic Architecture™, Value Exchange Velocity, Power Numbers™, Strategic Triggers™, Clear Paths™, Mathematical Freedom Recognition™, Trinity Framework™, and all related names, logos, and framework titles are trademarks or registered trademarks of Edward Azorbo in the United States, the European Union, and other jurisdictions.
Unauthorized use, reproduction, or modification of these marks and the proprietary methodologies they represent is strictly prohibited. All other trademarks and trade names are the property of their respective owners.