Value Exchange Velocity: The One Metric That Predicts Everything
Value Exchange Velocity™ measures how fast value moves between you and your market, combining conversion rate and decision speed into one unified metric that predicts business growth.
What Is Value Exchange Velocity™?
Value Exchange Velocity is the speed at which value moves from you to your market and payment moves from market to you—the unified metric that captures both how many say yes AND how fast they decide, revealing the true health of any business.
Unlike traditional metrics that measure isolated aspects of performance, Value Exchange Velocity provides a single number that predicts your entire business trajectory.
The formula is deceptively simple: Value Exchange Velocity = Conversion Rate × Decision Speed
But this simplicity masks profound strategic insight. While others track dozens of KPIs hoping to understand their business, Value Exchange Velocity reveals everything in one elegantly unified metric.
Why Every Other Metric Lies to You
The Revenue Deception
Revenue is history. It tells you what happened, not what’s happening. By the time revenue is down, the damage is done. You are reading yesterday’s newspaper while your business burns today.
A company can log record revenue while its Value Exchange Velocity plummets. Six months later, they are in crisis, wondering what went wrong. The answer? They were watching the wrong metric.
The Conversion Rate Trap
A high conversion means nothing if decisions take forever. A 50% conversion rate with 90-day sales cycles creates less value than a 20% conversion with 5-day cycles. The math is clear:
- Scenario A: 50% × (1/90 days) = 0.0056 Velocity
- Scenario B: 20% × (1/5 days) = 0.04 Velocity
Scenario B has 7x the velocity despite lower conversion. That’s 7x faster growth, 7x more opportunity, 7x better business health.
The Activity Illusion
Most businesses confuse motion with progress. More calls, more meetings, more proposals—all meaningless if value isn’t exchanged faster. You can double activity while velocity slows, creating the illusion of progress while in reality, you are declining.
The Four Velocity Zones
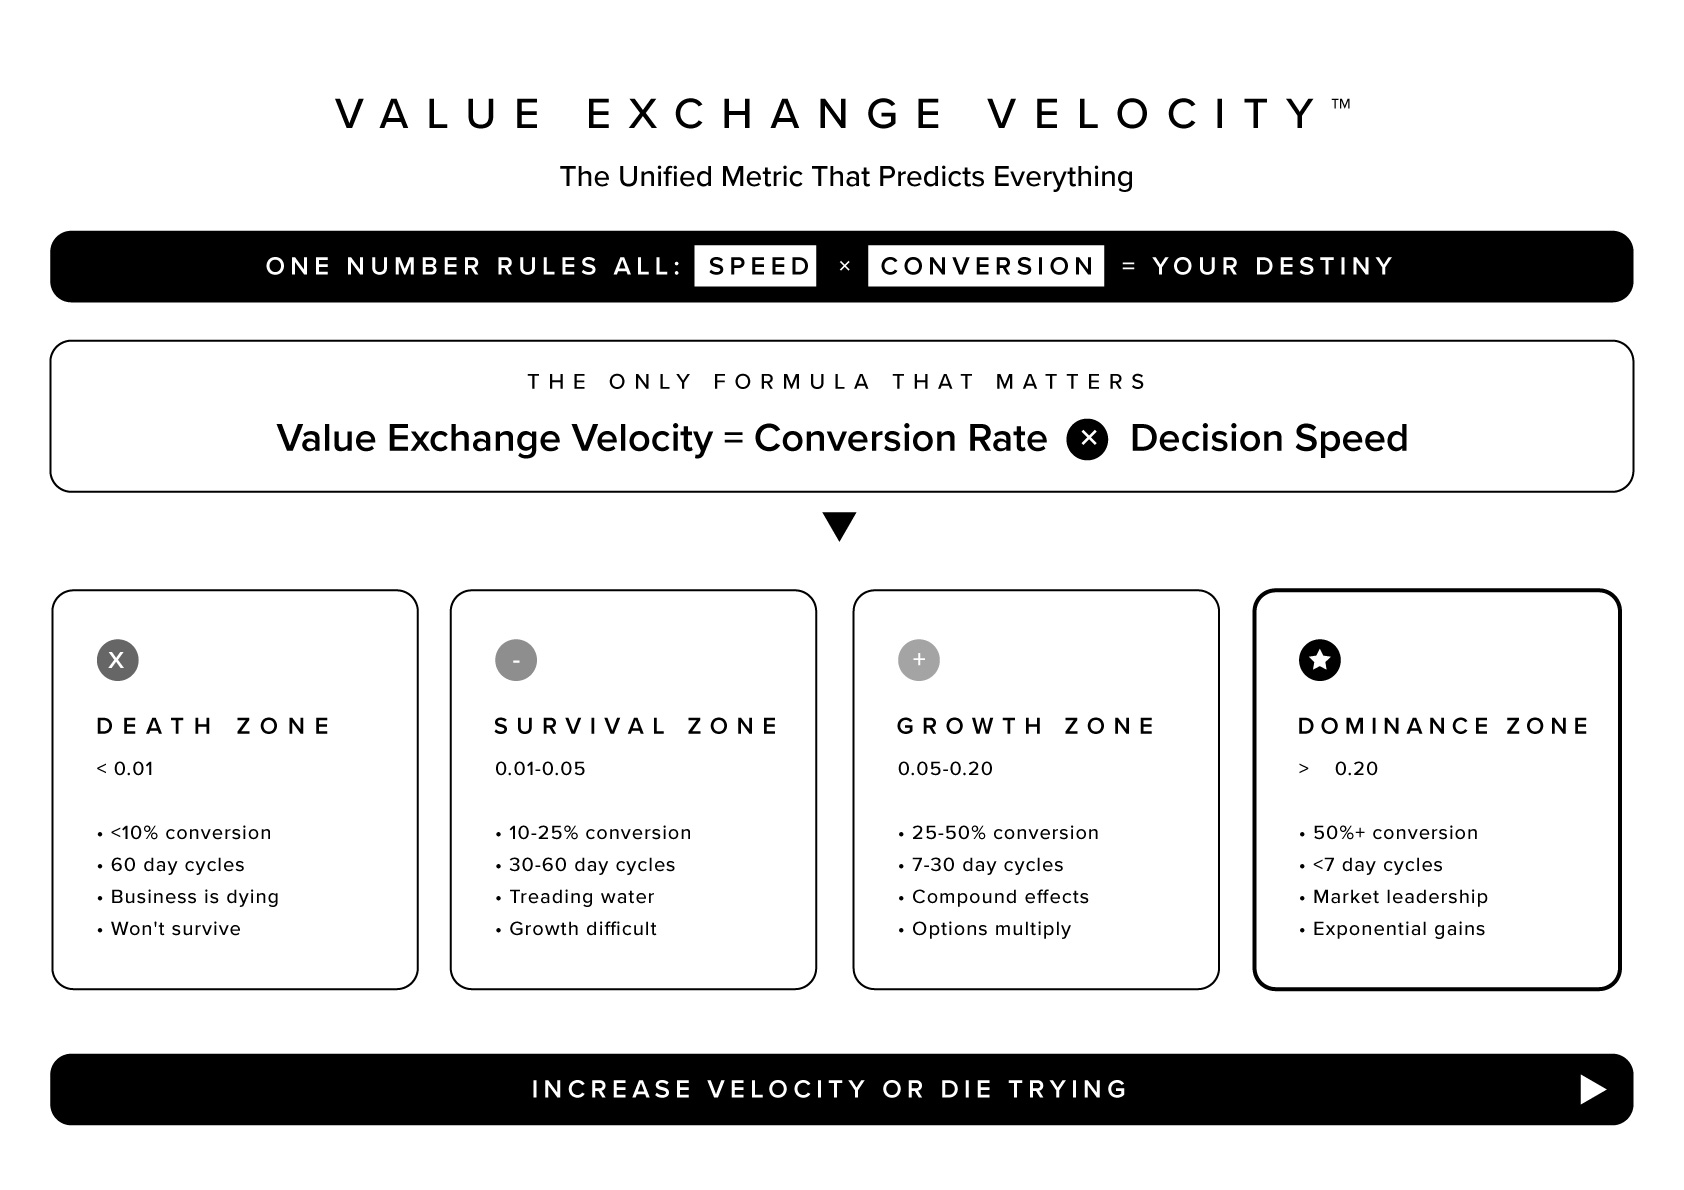
Death Zone: <0.01 Velocity
- <10% conversion with >60-day cycles
- Business is dying, whether you know it or not
- Emergency intervention required
- Most will not survive without radical change
Survival Zone: 0.01-0.05 Velocity
- 10-25% conversion with 30-60 day cycles
- Treading water, not drowning but not thriving
- Vulnerable to competition
- Growth is possible but hard-fought
Growth Zone: 0.05-0.20 Velocity
- 25-50% conversion with 7-30 day cycles
- Healthy expansion territory
- Compound effects are beginning
- Strategic options multiply
Dominance Zone: >0.20 Velocity
- 50%+ conversion with <7 day cycles
- Market-leading position
- Competitors cannot match the pace
- Exponential advantages stack up
The Four Velocity Blocks
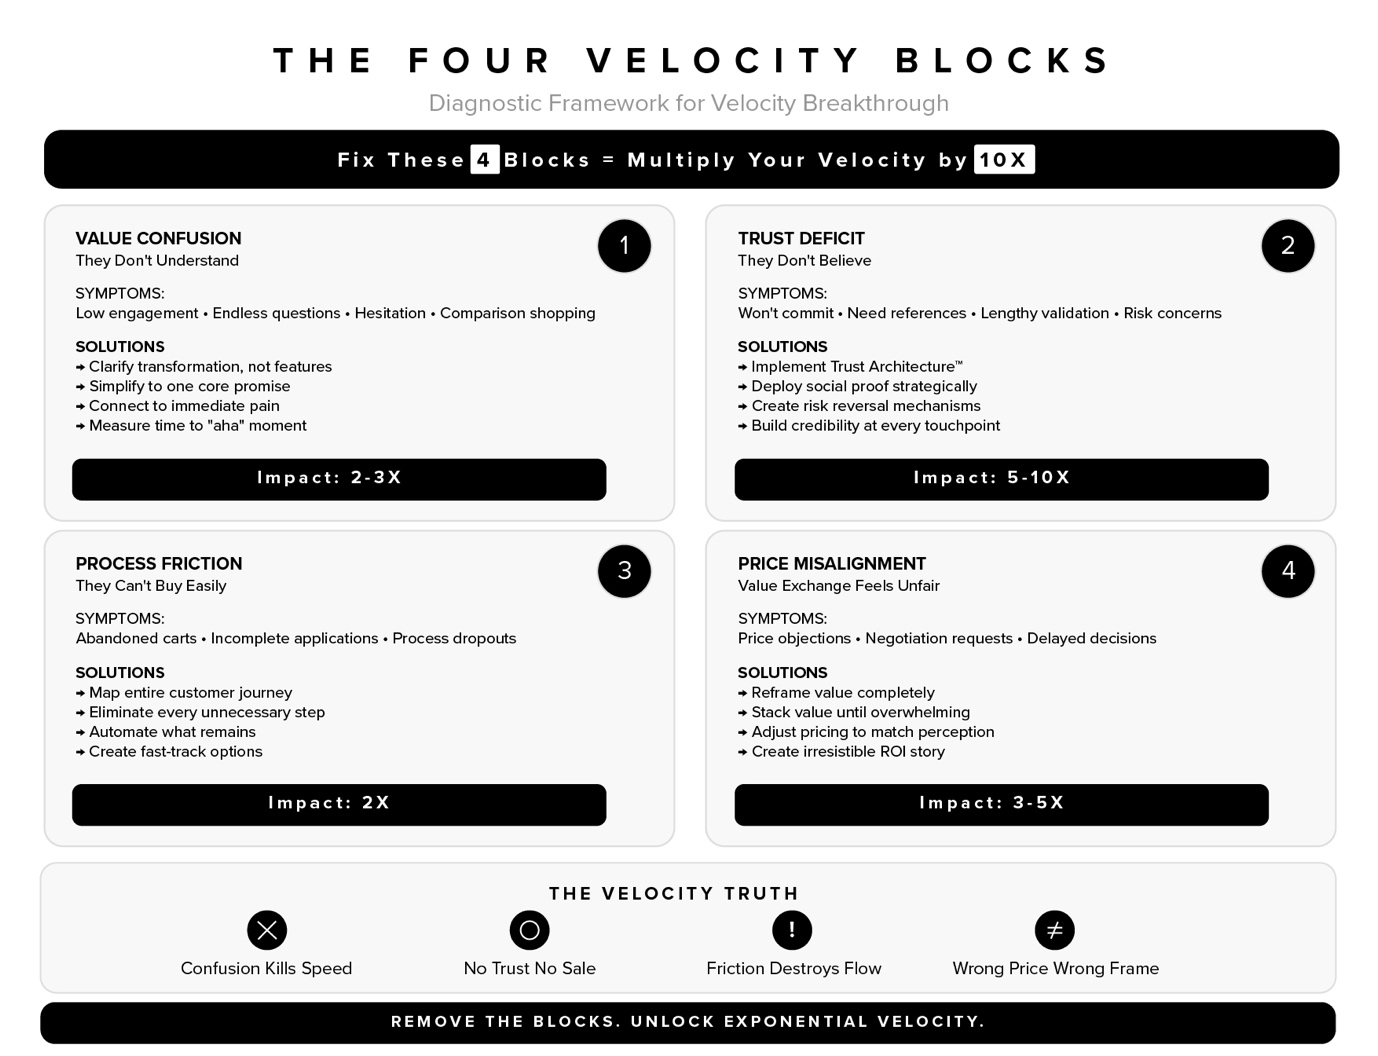
1. Value Confusion: They Don’t Understand
- Symptoms: Low engagement, endless questions, hesitation, comparison shopping
- Root Cause: Your value proposition is unclear, uncompelling, or unconnected to their reality
- Velocity Impact: Fixing confusion can double or triple velocity overnight
2. Trust Deficit: They Don’t Believe
- Symptoms: They understand the value but won’t commit, need references, prolonged validation
- Root Cause: Insufficient proof, credibility gaps, perceived risk
- Solution Architecture: Implement Trust Architecture™ systematically; create risk-reversal mechanisms
- Velocity Impact: Multiplying trust can multiply velocity by 5x or 10x
3. Process Friction: They Can’t Buy Easily
- Symptoms: Abandoned carts, incomplete applications, process drop-offs
- Root Cause: Unnecessary complexity, too many steps, unclear path
- Solution Architecture: Map the entire customer journey; eliminate every unnecessary step
- Velocity Impact: Eliminating friction typically doubles velocity
4. Price Misalignment: Value Exchange Feels Unfair
- Symptoms: Price objections, negotiation requests, delayed decisions
- Root Cause: Perceived value does not match price reality
- Solution Architecture: Reframe value entirely; stack value until it is overwhelming; create an irresistible ROI story
- Velocity Impact: Proper alignment can multiply velocity by 3x to 5x
Velocity as Macro Number: The Architecture Truth
Why Optimization Fails
Most businesses exhaust themselves optimizing micro-elements, resulting in incremental improvements: improved scripts (5-10%), better landing pages (10-15%), faster checkout (5-10%). The combined effect is marginal (perhaps 30-40% total improvement).
This is rearranging deck chairs on the Titanic.
Why Architecture Wins
Strategic Architecture™ moves create exponential impact:
- Trust Architecture™ Implementation: 200-500% improvement
- Strategic Repositioning: 300-1000% improvement
- Business Model Evolution: 10x+ possible
- Category Creation: 100x possible
The difference is not incremental—it is orders of magnitude.
The Strategic Hierarchy
Strategic Architecture (Design Level)
↓
Trust Architecture, Positioning, Model (Macro Level)
↓
Value Exchange Velocity (Outcome Metric)
↓
Conversion, Speed, Scripts, Pages (Optimization Level)
Velocity measures whether your architecture works, not whether your tactics are perfect.
The Power Move Hierarchy
Level 1: Fix What’s Broken
Basic functionality—necessary but not sufficient. Most businesses stop here, achieving mediocrity.
Level 2: Optimize What Works
Incremental improvements—the land of diminishing returns. Where good companies get stuck.
Level 3: Architect What’s Possible
Exponential transformation—where Strategic Architecture™ operates. Where great companies are built.
Implementation Playbook
Phase 1: Velocity Baseline (Week 1)
Measure Current State
- Calculate exact conversion rate
- Track average decision timeline
- Calculate baseline velocity
- Identify biggest friction point
Set Velocity Targets
- Conservative: 50% improvement in 90 days
- Aggressive: 2x improvement in 90 days
- Transformative: 5x improvement in 90 days
Phase 2: Friction Removal (Weeks 2-4)
Quick Wins
- Eliminate unnecessary form fields
- Simplify pricing presentation
- Add trust signals at key points
- Clarify value statements
Systematic Improvements
- Map the complete customer journey
- Identify all decision points
- Eliminate or simplify every friction
- Test and measure impact
Phase 3: Architectural Moves (Weeks 5-12)
- Trust Architecture: Build systematic credibility; engineer trust
- Value Clarity Revolution: Reframe the entire proposition; create «obvious yes» moments
- Process Architecture: Design for natural flow; engineer inevitability
Advanced Velocity Concepts
Velocity Elasticity
- Different segments have different velocity potential.
- High Elasticity: Small improvements yield massive gains.
- Strategic Focus: Invest where elasticity is highest.
Velocity Compound Effects
Velocity creates velocity:
Higher Velocity → More Revenue → More Resources →
Better Systems → Higher Trust → Even Higher Velocity
This compound loop explains why market leaders accelerate away from the competition.
Velocity Defense
- Monitor velocity weekly (not monthly)
- Detect decline early (before revenue impact)
- Restore velocity aggressively
Velocity in Strategic Context
As Strategic Diagnostic
- Low velocity despite optimization = Architectural problem
- High velocity with basic optimization = Architectural advantage
- Declining velocity = Architecture degrading
As Strategic Goal
- Startup Phase: Primary survival metric
- Growth Phase: Scaling engine, where compound effects multiply
- Maturity Phase: Optimization focus, guarding against decline
The Velocity Mindset
Organizational Alignment
Everyone serves velocity:
- Marketing: Accelerates understanding
- Sales: Accelerates decision
- Product: Accelerates value delivery
- Operations: Eliminates all friction
Daily Velocity Questions
For Leaders:
- Is our velocity trending up or down?
- What is our single biggest velocity block?
For Teams:
- Does this increase conversion OR speed?
- Where is the friction in this process?
The Architectural Questions
Wrong Questions (Optimization thinking):
- «How do we improve our funnel?»
- «What should we A/B test next?»
Right Questions (Architectural thinking):
- «What architectural change would 10x our velocity?»
- «What trust system would make decisions instantaneous?»
Velocity as Business Physics
Value Exchange Velocity is not just a metric—it is the laws of business physics. Like blood flow in the body or current in a circuit, velocity determines whether your business thrives or dies.
The Strategic Truth: While competitors optimize parts, you optimize physics. While they increase activity, you increase velocity. While they try harder, you reduce friction.
In a world drowning in metrics, Value Exchange Velocity stands as the one number that predicts everything. Master velocity, master the business.
Ready to engineer exponential velocity in your business? Get the complete Strategic Architecture™ methodology delivered weekly → Subscribe to our Substack newsletter for frameworks that transform business physics through architectural thinking.
FAQ
Value Exchange Velocity is the speed at which value moves from business to market and payment from market to business, measuring both conversion rate and decision speed in one unified metric.
Basic formula: Value Exchange Velocity = Conversion Rate × Decision Speed (1/days to decision). Example: 30% conversion with 10-day decisions = 0.03 velocity.
Velocity is predictive while revenue is historical. It reveals business health before problems appear and unifies all performance metrics into one number that can’t be gamed.
Death Zone (<0.01), Survival Zone (0.01-0.05), Growth Zone (0.05-0.20), and Dominance Zone (>0.20), each representing different levels of business health and growth potential.
Focus on architectural moves like Trust Architecture implementation (200-500% improvement) rather than micro-optimizations. Remove the four velocity blocks: confusion, trust deficit, friction, and price misalignment.
Trademark Notice
© 2025 Edward Azorbo. All rights reserved.
Strategic Inevitability™, Strategic Architecture™, Power Numbers™, iPolaris™, Strategic Triggers™, Clear Paths™, Mathematical Freedom Recognition™, Trinity Framework™, Value Exchange Velocity™, Trust Architecture™, and all related framework names, logos, and titles are trademarks or registered trademarks of Edward Azorbo in the United States, the European Union, and other jurisdictions.
Unauthorized use, reproduction, or modification of these marks and the proprietary methodologies they represent is strictly prohibited. All other trademarks and trade names are the property of their respective owners.